
Teaching an offline plant doctor to spot rust
I wanted a phone to name a plant’s problem, privately. Rust taught me why a better score could still leave someone more worried—and what I changed.
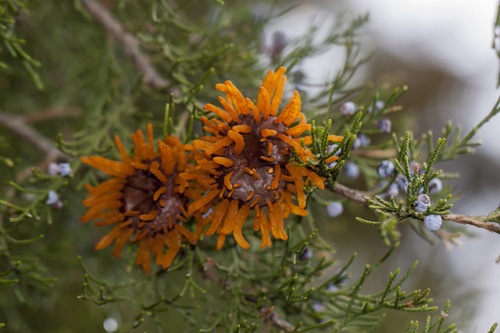
Rust in the dataset.
Rust to the classifier.
Selected v2 research head-only match.
iNaturalist observation · CC0 ↗Rust photos matched by the rules-only pipeline.
Matched with a crop-trained classifier plus rules.
Matched with the later classifier plus rules. Nine still missed.
My wife looks after our plants with a long list of fixes: rice water, onion water, neem, peroxide, sulphur, compost, repotting, more sunlight, turning the pot when a plant starts leaning to one side, and plenty more. She doesn't choose by species, or by a name for the problem. She goes by what she feels is wrong with the plant. And it works, somewhat.
Somewhere along the way of building SASYA, I took it upon my ego that I could suggest better. Not a feeling, but a diagnosis: the exact problem and the exact fix. A photo, an answer, right there on the phone, with the photo never leaving the device.
My method didn't always win. When it failed, I went back to figuring out why. Sometimes I gave up and uploaded the photo to ChatGPT, which came back with something that more or less worked. Now I had two advisers who were somewhat right. That bothered me more than failing. I wanted more than somewhat. I wanted to one-up the chatbot, and my wife.
Rust is where that ambition ran into the data.
Zero out of twenty-four
Rust is about as visible as plant problems get: orange, powdery spots, like the ones in the photo at the top. I collected 24 rust photos from iNaturalist and ran them through my pipeline.
It named rust first on none of them.
Here is what the pipeline did. An image encoder turned each photo into 512 numbers describing what it looks like. My system then squeezed those 512 numbers down to 34 scores, one for each description I had written: spots, powder, webbing, yellowing. Rules took those clues and named a problem.
I liked that design because I could read it. Every answer came with its reasons. But staring at zero out of twenty-four, I started to believe rules would never work. Either I needed a much bigger classifier, or I would have to do the thing I had been avoiding: hand the photo to a large language model and let it work things out.
Letting the model see the whole picture
Before giving in, I asked a smaller question. By squeezing 512 numbers into 34 descriptions, had I thrown away exactly what the rules needed?
I kept the same image encoder and trained a small classifier on all 512 numbers instead. On PlantDoc, a public set of crop-disease photos, accuracy on a six-group test rose from 68.6% to 80.1% across 236 photos. It was a rough comparison (the caveats are in the methods below), but it was enough to keep going.
The real test had to look like a phone in a garden, not a dataset. I went through 445 iNaturalist photos by hand and kept 286 that look like what a grower actually sees: damaged leaves, pests on plants, and 25 plants that appeared healthy.
Rust went from 0 to 7 out of 24.
The better score made things worse
Then I checked the healthy plants. Before, the system had raised a false alarm on 2 of the 25. Now it raised one on 6.
That stopped me. If my wife had pointed it at a healthy plant, roughly one time in four it would have told her something was wrong.
I had been chasing the score. The score went up, and the app became more alarming. Recognising rust mattered, but so did knowing when to leave a plant alone.
More real photos, fewer false alarms
The fix was better teaching material. I retrained the classifier on 2,970 iNaturalist photos plus PlantDoc, with the same image encoder.
Rust rose to 15 out of 24. False alarms fell to 3 of the 25 healthy plants: better than the first classifier, though still one more than rules alone.
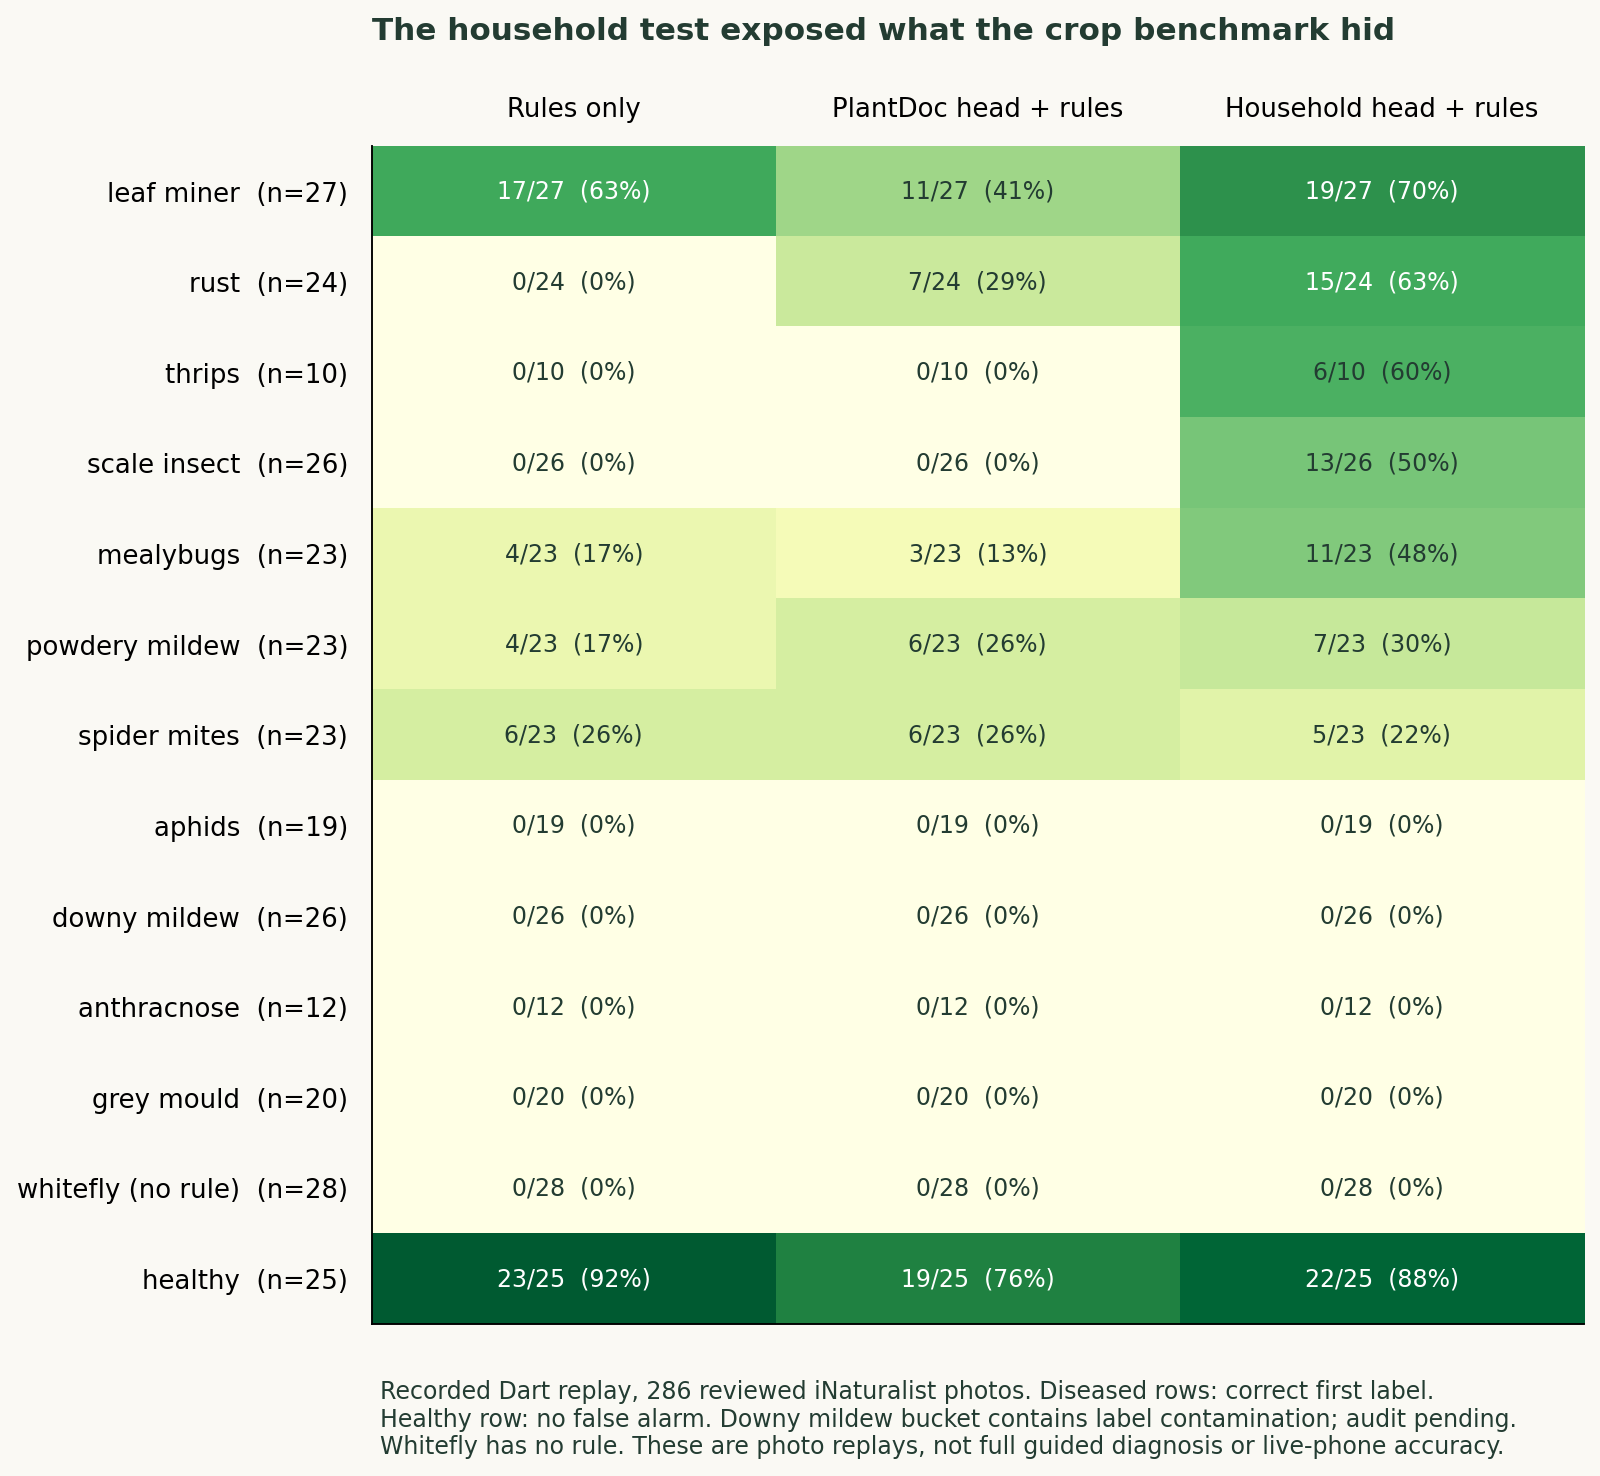
Recorded replays: matching first labels for issues; no alarm for provisional healthy controls. Labels come from observation taxa and visual review, without lab confirmation. “Guided” in the table means the first suggestion only.
Exact counts · all 286 photos
Hits: matching first label, or no alarm for provisional healthy controls. Recorded replays. “Guided” means the first suggestion, not a completed session.
| Dataset label | Rules | PlantDoc head + rules | Household head + rules | Guided first suggestion |
|---|---|---|---|---|
| leaf miner | 17/27 | 11/27 | 19/27 | 21/27 |
| rust | 0/24 | 7/24 | 15/24 | 15/24 |
| thrips | 0/10 | 0/10 | 6/10 | 6/10 |
| scale insect | 0/26 | 0/26 | 13/26 | 13/26 |
| mealybugs | 4/23 | 3/23 | 11/23 | 10/23 |
| powdery mildew | 4/23 | 6/23 | 7/23 | 7/23 |
| spider mites | 6/23 | 6/23 | 5/23 | 3/23 |
| aphids | 0/19 | 0/19 | 0/19 | 0/19 |
| downy mildew (label audit needed) | 0/26 | 0/26 | 0/26 | 0/26 |
| anthracnose | 0/12 | 0/12 | 0/12 | 0/12 |
| grey mould | 0/20 | 0/20 | 0/20 | 0/20 |
| whitefly (no rule) | 0/28 | 0/28 | 0/28 | 0/28 |
| healthy (provisional) | 23/25 | 19/25 | 22/25 | 22/25 |
Nine rust photos still went unmatched. And aphids stayed at 0 out of 19. One aphid photo was called thrips with a score of 97.4%. That number is how strongly the model leaned, not the chance it was right. It was wrong.
What a plant pathologist taught me
What changed my thinking was an old lecture. In 2002, Bob Raabe, a plant pathologist at UC Berkeley, taught a class of Master Gardener students how to diagnose plant problems. He doesn't look at a leaf and name a fungus. He works through the causes, from watering and soil to bacteria and fungi, and rules them out one by one. Even brown leaf tips can have several causes, as UC IPM's houseplant guide shows.
That was the humbling part. I had been trying to beat my wife and a chatbot at naming the problem in one shot. The expert doesn't even try.
SASYA already asks questions like his. After the photo, a step-by-step check asks things like "How recently was this plant watered?", "Has it been repotted in the last few weeks?" and "Check another leaf. Do you see it there too?" Asking helps. But the way it asks today isn't very intuitive, and that can steer it towards the wrong disease, or a generic one.
So that's what I'm working on now: getting the phone to do more of that looking itself, instead of leaning on a questionnaire.
My test set needs work too. Some photographers appear in both the training and test photos, and the downy-mildew group contains the wrong organisms. Those get fixed before I claim any accuracy number.
Where this leaves me
I set out to one-up my wife and ChatGPT. I haven't, not yet. What I have is a plant doctor that recognises rust far better than it did, worries less about healthy plants, and is clearer about what it can't see.
And I have a better question to ask of every change: does this help the person looking at the plant? Sometimes that person is my wife. She was never really the competition.
Worked on a similar problem, or have a method I should try? Write to me at hello@sasya.app. I’d love to compare notes.
Six photo cases · predictions and credits
Two matching labels, three mistakes, and an abstention. Selected v2 head-only outputs; dataset labels are provisional. Softmax scores are not calibrated diagnostic probabilities.
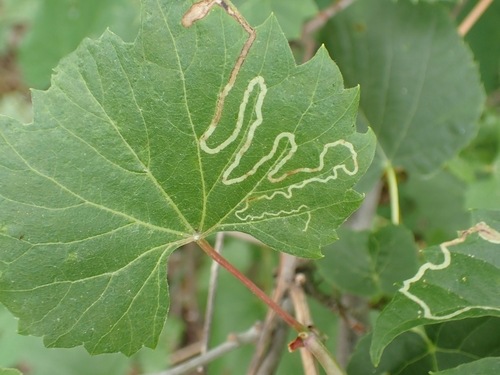
leaf miner leaf miner
Raw top: leaf miner · 88.0% softmax.
Phyllocnistis vitifoliella
(c) Mary Krieger, some rights reserved (CC BY). Observation ↗ · Photo & licence ↗
rust rust
Raw top: rust · 99.9% softmax.
Gymnosporangium juniperi-virginianae
no rights reserved. Observation ↗ · Photo & licence ↗ · CC0
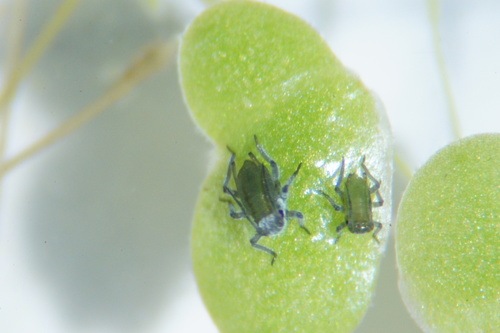
aphids thrips
Raw top: thrips · 97.4% softmax.
Rhopalosiphum nymphaeae
no rights reserved. Observation ↗ · Photo & licence ↗ · CC0
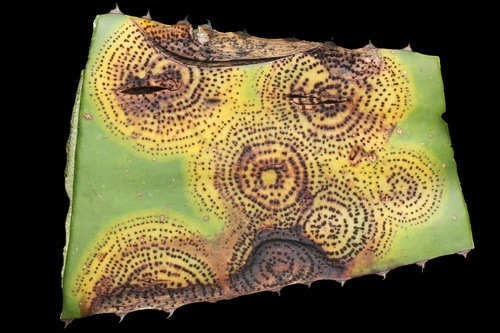
anthracnose rust
Raw top: rust · 83.4% softmax.
Colletotrichum agaves
(c) Alan Rockefeller, some rights reserved (CC BY). Observation ↗ · Photo & licence ↗
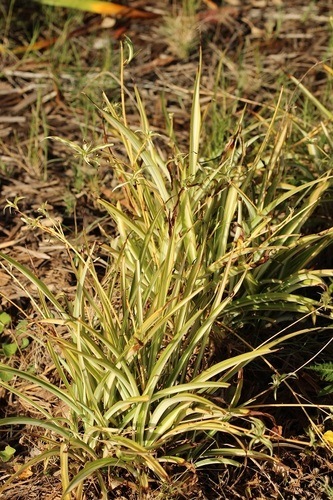
healthy rust
Raw top: rust · 64.9% softmax.
Chlorophytum comosum
(c) Karen Eichholz, some rights reserved (CC BY). Observation ↗ · Photo & licence ↗
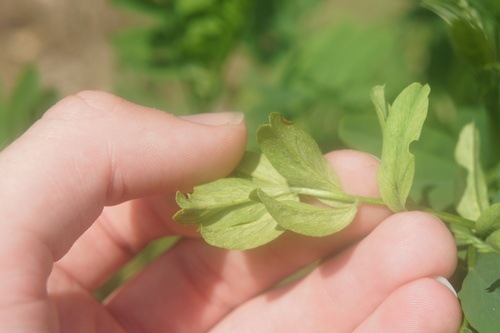
downy mildew abstain
Raw top: downy mildew · 74.8% softmax · threshold disabled.
Peronospora galegae
(c) Alex Press, some rights reserved (CC BY). Observation ↗ · Photo & licence ↗
Photos resized; no lesion edits. CC BY versions were not cached; original licence records are linked above.
Methods, sources, and limits
Prepared 31 October 2026. These notes separate three kinds of evidence. The model comparisons describe research experiments; they do not establish the model used in a released app version.
1. Recorded experiments
The household results come from saved benchmark reports, not new full-pipeline runs. Exact counts were reconstructed from reported denominators and rounded percentages. Every denominator is at most 28, and each reconstructed count is uniquely determined. The article includes the full count table. The reported rust progression (0/24, 7/24, 15/24) is a category-level comparison; it does not establish before-and-after predictions for the individual hero photo.
These reports use cached whole-photo embeddings with mocked native-channel similarities. They measure the first Disease-tab label, the rules path, and the first suggestion of guided diagnosis. They do not measure a full guided session, live reticle crops, device latency, or biologically confirmed diagnoses.
The PlantDoc six-class comparison in Figure 01 comes from a research experiment note dated 24 October 2026. It has not been retrained or independently reproduced for this publication. Reported top-1: 68.6% for trait similarities versus 80.1% for image embeddings; n=236. This is a six-group task, distinct from an earlier 27 crop-and-disease-label experiment.
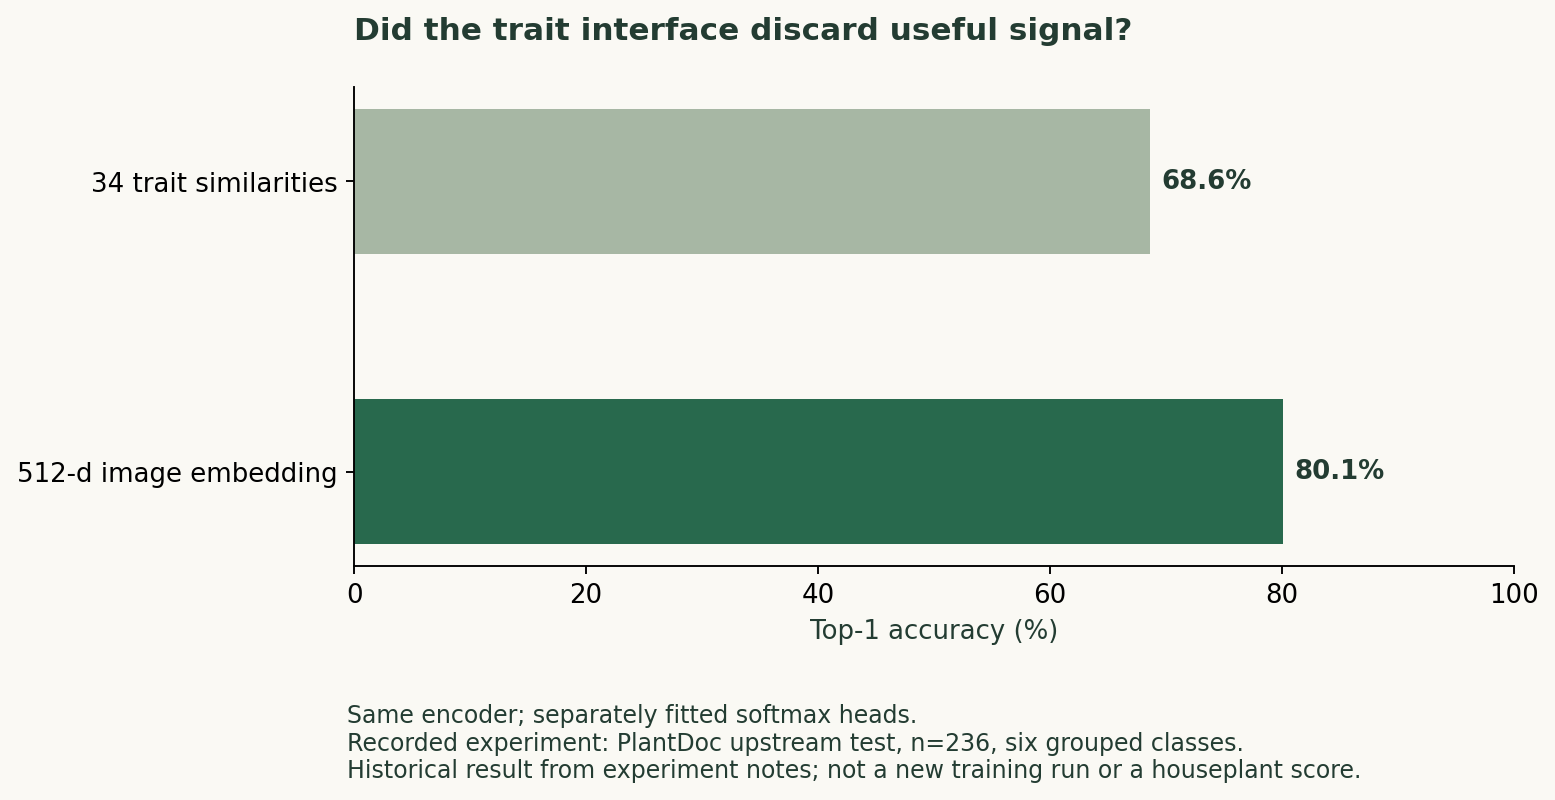
Same encoder, six grouped classes, 236 test photos; recorded research experiment.
The historical training procedure has methodological limits: trait standardization uses the whole dataset, and preprocessing is not refitted independently inside every cross-validation fold. Treat the historical comparison as exploratory evidence. Future comparisons should fit preprocessing inside folds and leave the final test untouched.
The v1 research head was subsequently refitted on all PlantDoc images. The v2 trainer also uses PlantDoc, including its original test split. Neither fitted head may now be evaluated on PlantDoc and described as held out.
2. Fresh research head-only inference
The replay uses saved classifier weights and 286 previously computed, 512-dimensional image embeddings, aligned with the reviewed test manifest. It evaluates a linear condition head rather than a complete plant-diagnosis system.
The replay normalizes embeddings and stored class vectors, computes logit = cosine × norm + bias, applies softmax, and names the winning class only if it has an enabled threshold and meets that threshold. It uses the fitted head’s rounded weights. It does not train anything, run the image encoder, or execute the rule fallback.
Head-only hits include 15/27 leaf miners, 15/24 rust, 13/26 scale insects, 6/10 thrips and 0/19 aphids. The head abstains on 24/25 healthy controls, which is not proof that those plants are healthy. The recorded combined pipeline has different counts because it includes fallback rules.
The six photo examples are deliberately selected: two matching labels, three wrong labels, and an abstention. They are not a random sample or a calibration study. Softmax scores are model outputs, not calibrated probabilities of biological diagnosis.
The original full-pipeline evaluation requires the separate app source, prompts, replay cache, and corresponding model snapshot. It was not run while preparing this article. No claim of exact historical app-source revision parity is made.
3. Fresh metadata audit
The audit checks the research manifests:
- 445 original test entries, 286 visually reviewed entries, 2,970 training entries.
- Zero shared photo IDs and observation URLs between the original test manifest and training.
- 205 shared observer IDs across the original test manifest and training; 150 for the reviewed subset. Those 150 account for 214 reviewed photos.
- Zero shared
(issue, observer)pairs in the reviewed subset versus training. Per-issue exclusion is weaker than global observer exclusion. - Two reviewed downy-mildew entries are tagged Phytophthora ramorum. Thirty of 153 training entries in that bucket are Phytophthora taxa. The condition mapping needs correction before interpreting that row as a clean downy-mildew evaluation. UC IPM: ramorum blight and sudden oak death.
- Current iNaturalist training counts include 12 spider-mite photos, 2 grey-mould photos, and no anthracnose photos. These are counts from the inspected manifest; older notes mention a different spider-mite count.
This audit does not detect perceptual duplicates, confirm all taxa, certify healthy controls, or estimate population accuracy. Research-grade observation identification is not lab confirmation of disease; cultivated healthy controls include casual-grade observations. The set was reused during development and is not a final untouched evaluation.
Photo sources and attribution
Photo rights remain with their credited contributors. Each of the six examples in the article’s photo-case section includes its contributor, observation link, and original photo licence record. The photos were resized; the composite adds letterboxing, text, and model outputs. No disease features were added or removed. CC BY licence versions were not stored in the cache; refer to the linked original photo licence records.
Proposed tests
A complete guided session has not been shown to improve diagnosis in these experiments. A proposed sequence checks image quality, records visible findings, inspects additional leaves and undersides, asks about relevant care changes, then re-ranks candidates or leaves the result uncertain.
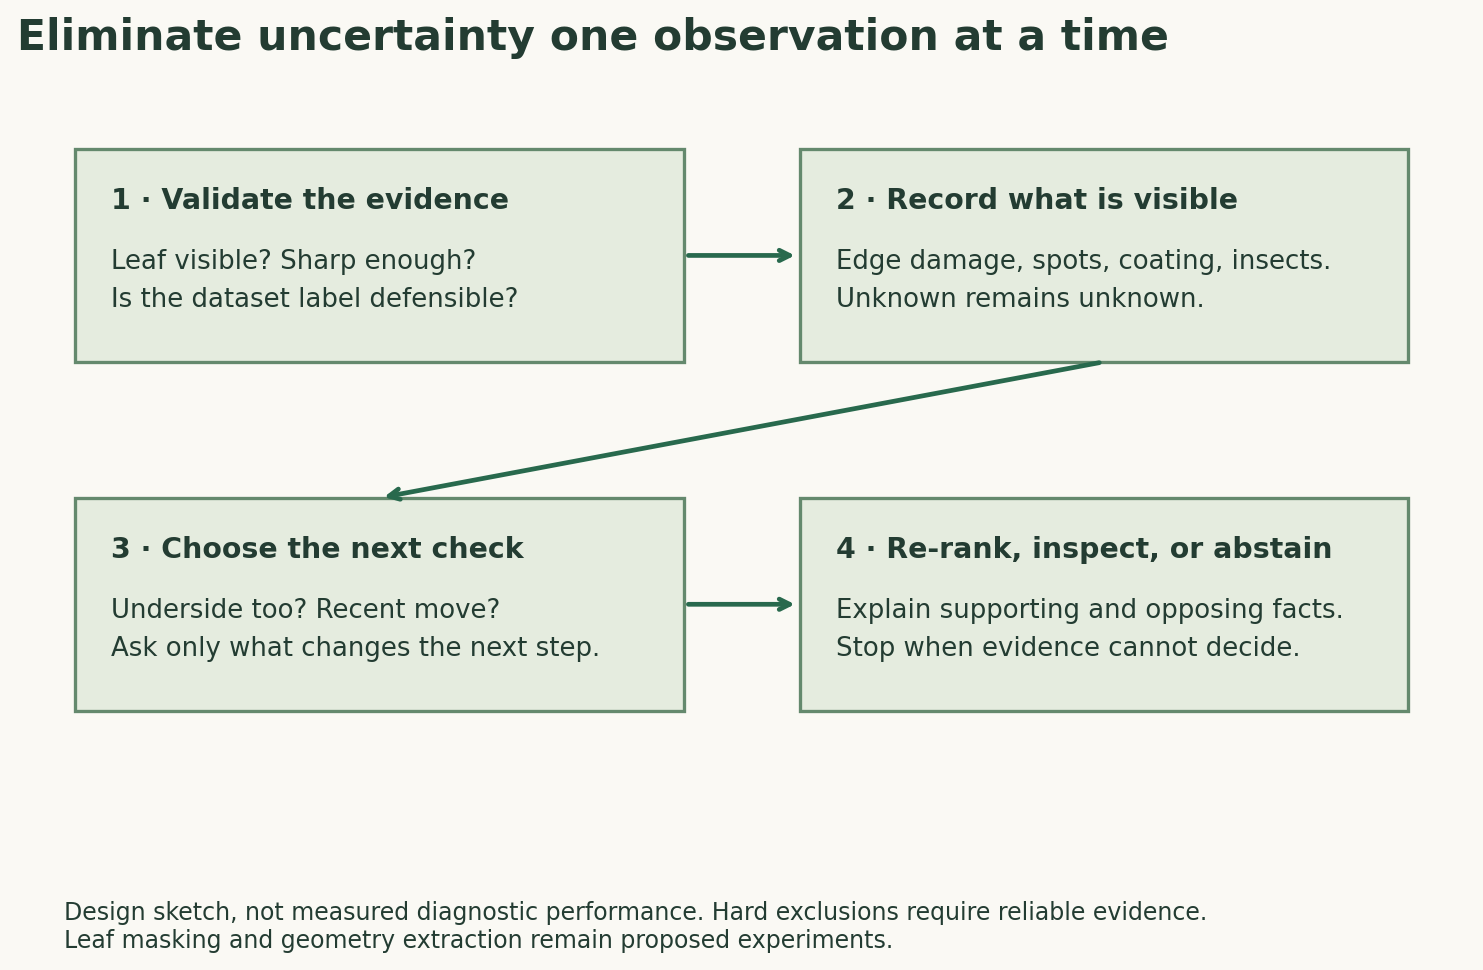
Design sketch; diagnostic improvement remains unmeasured.
| Question | Controlled comparison | Measure |
|---|---|---|
| Is background or scale the problem? | Whole frame versus annotated leaf crop | Paired gains and losses, per issue |
| Does a damage mask help? | Leaf crop versus crop plus candidate mask | Lesion retention, false masks, downstream changes |
| Is the representation insufficient? | Encoders on identical splits | Recall at comparable precision/coverage; device size and latency |
| Do questions help? | Photo alone versus grower findings versus full sequence | Correctness, false alarms, abstention, question count |
Removing green pixels is not established leaf segmentation: brown pots survive a colour threshold, variegation can resemble damage, and pests can live on green tissue. Missing an insect in one frame does not establish its absence.
Visual patterns also have exceptions. Bacterial leaf spots can begin circular and become angular; geometry alone cannot reliably separate bacteria from fungi. UC IPM: bacterial leaf spots.
Future validation should fit preprocessing inside training folds, group observers across issues, review duplicates and labels, and reserve an untouched final set. Care-problem claims need adequate watering and light examples. No new training run or live-phone evaluation was performed for this article.